A real-world story of parallelism, metadata-driven orchestration, and not crying at 4 AM waiting for pipelines to finish.
Contents
The Setup (a.k.a. “everything was fine until it wasn’t”)
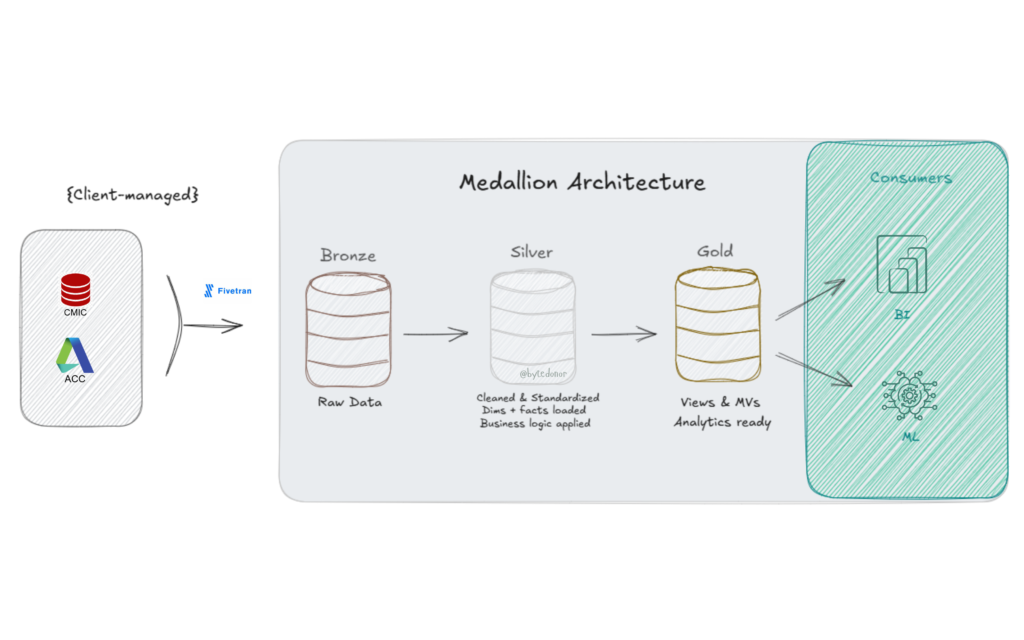
Picture this, Classic Databricks Medallion Architecture (Bronze, Silver, Gold). Data lands in Bronze via Fivetran (client-managed, not my problem 🙏). My job starts at Bronze and ends at a clean, analytics-ready Gold layer. Simple enough, right?
Here’s what the stack looked like:
For the Bronze → Silver leg, I had three specialized notebooks handling different load patterns:
| Notebook | What it does |
|---|---|
| nb_silver_dim_loader | Handles SCD1 & SCD2 dimension loads |
| nb_silver_fact_loader | Full overwrite for fact tables |
| nb_silver_fact_incremental_loader | Incremental merge for high-volume facts |
Sitting above all three? An orchestrator notebook, the conductor. It reads a metadata table, figures out what needs to run, and calls the right notebook for each table.
Sounds clean. And for a while, it was.
Then the table count grew and the pipeline that used to wrap up in 45 minutes started clocking in at 2.5 hours. Every Single Day 🙁
That’s when I knew we had a problem.
The Problem: Sequential Execution is a Silent Killer
Here’s what was actually happening under the hood.
The original orchestrator was doing this (conceptually):
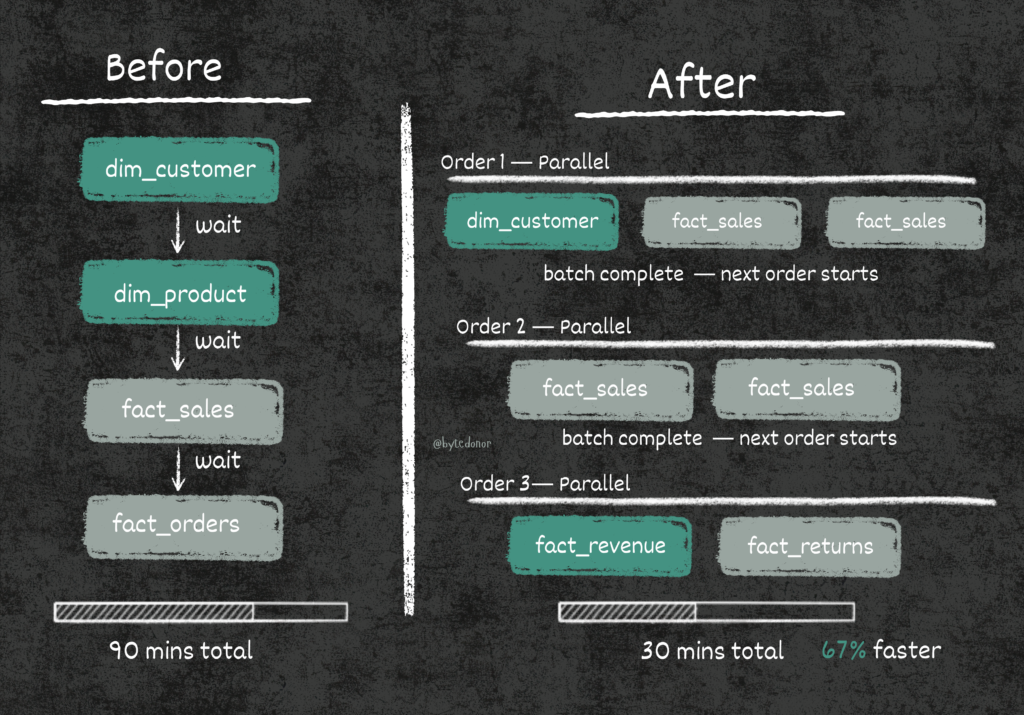
Run Table A → wait → Run Table B → wait → Run Table C → wait → ...One table at a time. Fully sequential. Every notebook call was blocking the next one. If Table A took 8 minutes, nothing else could start until it finished. This is the equivalent of cooking a full meal by finishing the pasta, then starting the sauce, then boiling the water. Nobody does that. But that’s exactly what our pipeline was doing. So, I dug in. And what I found was embarrassingly simple.
The original logic looked roughly like this (simplified version of what we had):
# Old approach - clean but painfully sequential
results = [run_silver_task(task) for task in tasks_to_run]One list comprehension. One task at a time. For 140+ tables across Bronze → Silver → Gold, you can do the math on why we were bleeding time.
Now, sequential made sense initially and the reason was legit: dimension tables need to load before fact tables. You can’t have a fact row referencing a dim key that doesn’t exist yet. Real dependency, real constraint. But that constraint doesn’t mean everything has to wait for everything else. That’s where we were going wrong.
The Fix, Part 1: Metadata-Driven Execution Orders
Before I could introduce parallelism, I needed a way to encode dependencies safely. The answer was already sitting in my metadata table, just unused.
Here’s the DDL for the execution table:
CREATE TABLE dev_silver.metadata.execution_table (
  src_system        	  STRING,
  src_catalog       	  STRING,
  src_table_name    	  STRING,
  src_schema        	  STRING,
  load_type         	  STRING,
  dst_catalog       	  STRING,
  dst_table_name    	  STRING,
  dst_schema        	  STRING,
  layer             	  STRING,
  is_active_flag    	  BOOLEAN,
  execution_order   	  INT,           -- 👈 the whole game lives here
  execution_pipeline 	  STRING,
  business_key_columns  ARRAY<STRING>,
  primary_key_columns   ARRAY<STRING>,
  sql_file_path     	  STRING,
  cdc_source_config 	  STRING,
  comment           	  STRING
)The magic column is execution_order. Here’s how I used it:
- Order 1 → All dimension tables (SCD1/SCD2). No dependencies, run them first.
- Order 2 → Fact tables that depend only on dims from Order 1.
- Order 3 → Fact tables that depend on other facts from Order 2.
The rule: within the same execution order, tables are independent and can run in parallel. Across orders, we wait for the previous batch to complete before starting the next.
This is basically topological sorting, but implemented in a metadata table that any data engineer on the team can update, no code changes needed. Add a new table? Just assign it an execution_order and flip is_active_flag to True. That’s it.
The Fix, Part 2: Parallelism with ThreadPoolExecutor
Now that I had a safe execution order model, I could rewrite the orchestrator to run tasks in parallel within each batch.
Here’s the full updated Bronze → Silver orchestrator:
Step 1: Identify the Tasks
layer_name = 'bronze_to_silver'

tasks_df = METADATA_DF.filter(
    (col('layer') == layer_name) &
    (col('is_active_flag') == True)
).select('dst_table_name', 'execution_pipeline', 'execution_order').distinct()

if tasks_df.count() == 0:
    dbutils.notebook.exit('No active Silver Layer tasks found.')

unique_orders = [
    row.execution_order
    for row in tasks_df.select('execution_order').distinct().orderBy('execution_order').collect()
]

print(f"Found {tasks_df.count()} tasks across {len(unique_orders)} execution batches.")
display(tasks_df.orderBy('execution_order'))This reads from the metadata table, pulls only active tasks for the bronze_to_silver layer, and extracts the distinct execution orders. These orders become our batch sequence.
Step 2: Define the Task Runner
def run_silver_task(task):
    dst_table = task['dst_table_name']
    pipeline_type = task['execution_pipeline']

    runner_notebook_map = {
        'scd1': '../silver/nb_silver_dim_loader',
        'scd2': '../silver/nb_silver_dim_loader',
        'fact_overwrite': '../silver/nb_silver_fact_loader',
        'fact_incremental_merge': '../silver/nb_silver_fact_incremental_loader'
    }

    notebook_to_run = runner_notebook_map.get(pipeline_type)
    if not notebook_to_run:
        return (dst_table, 'SKIPPED', f"No runner notebook found for pipeline type: {pipeline_type}")

    print(f"[STARTING] Task: {dst_table} using pipeline: {pipeline_type}")
    try:
        result = dbutils.notebook.run(
            path=notebook_to_run,
            timeout_seconds=7200,  # 2 hour timeout per task
            arguments={'dst_table_name': dst_table}
        )
        return (dst_table, 'SUCCESS', result)
    except Exception as e:
        error_message = str(e)
return (dst_table, 'FAILED', error_message)The runner_notebook_map is a clean dispatch pattern, the orchestrator doesn’t need to know how SCD2 loading works. It just knows which notebook handles it and passes the table name as an argument. Each notebook is self-contained and idempotent.
The 2-hour timeout per task is non-negotiable. Without it, a hung notebook can block your entire thread pool indefinitely. Don’t skip this.
Step 3: The Actual Parallelism
results = []
all_tasks = [row.asDict() for row in tasks_df.collect()]

for order in unique_orders:
    tasks_in_group = [t for t in all_tasks if t['execution_order'] == order]
    print(f"n>>> Processing Execution Order: {order} ({len(tasks_in_group)} tasks in parallel)")

    with ThreadPoolExecutor(max_workers=5) as executor:
        group_results = list(executor.map(run_silver_task, tasks_in_group))
results.extend(group_results)This is the heart of the change. For each execution order:
- We collect all tables assigned to that order.
- We fire them all simultaneously using
ThreadPoolExecutorwith up to 5 parallel workers. - We wait for all tasks in the batch to complete before moving to the next order.
The max_workers=5 limit is intentional. It prevents overwhelming the cluster with too many concurrent notebook calls. Tune this based on your cluster size and the nature of your workloads.
Step 4: Summarize Results and Fail Loudly
successful_tasks = [res for res in results if res[1] == 'SUCCESS']
failed_tasks     = [res for res in results if res[1] == 'FAILED']
skipped_tasks    = [res for res in results if res[1] == 'SKIPPED']

print("n--- SILVER LAYER SUMMARY ---")
print(f"Total tasks processed: {len(results)}")
print(f"Successful: {len(successful_tasks)}")
print(f"Failed:     {len(failed_tasks)}")
print(f"Skipped:    {len(skipped_tasks)}")

if failed_tasks:
    print("n--- FAILED TASK DETAILS ---")
    for task, status, message in failed_tasks:
        print(f'Task: {task}n  Error: {message}n')
    raise Exception("One or more Silver Layer tasks failed. Please check the logs.")

print("nSilver Layer run completed.")This part matters more than people think. If any task fails, we:
- Print every failed task with its full error message.
- Raise an exception to fail the orchestrator job visibly.
Silent failures in data pipelines are genuinely dangerous. Your downstream Gold layer will just quietly produce wrong numbers. Fail loudly, fix fast.
The Results
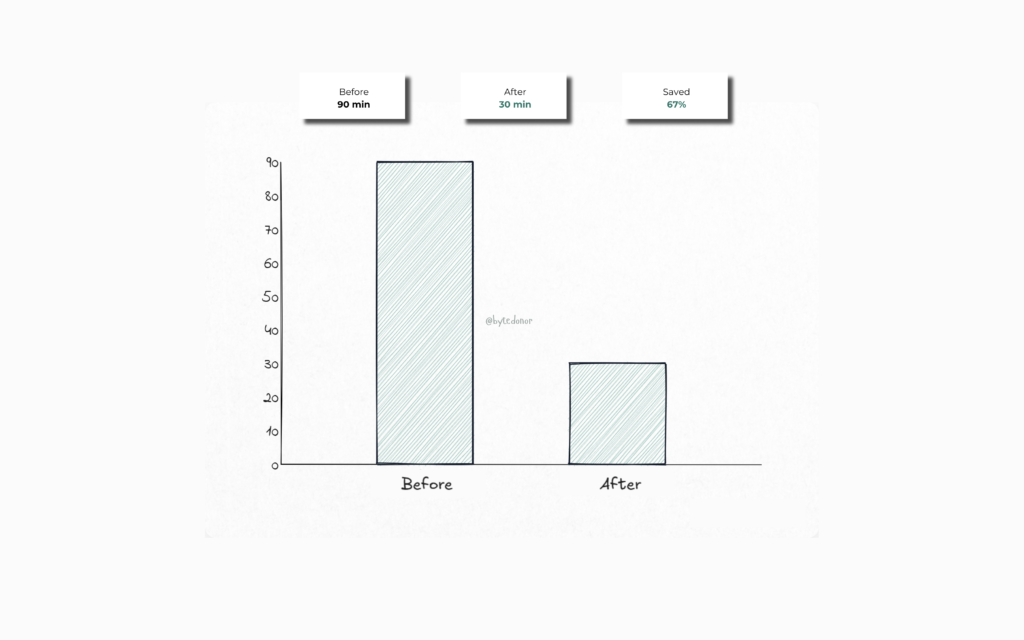
That’s a 60%+ reduction in runtime without touching the underlying notebooks, without changing the cluster size, and without spending a single extra dollar on compute.
The first time the pipeline finished in under 30 minutes I just sat there staring at the clock in disbelief. No more doom-scrolling through job logs at 4 AM. No more that sinking feeling when the run time kept climbing. It was just… done. Clean, fast, and on time. The kind of quiet win that makes you exhale for the first time in months.
The metadata-driven approach also means the team can onboard new tables by just inserting a row into the execution table. No PR needed for the orchestrator. No code review for adding a new dim or fact. Just update the metadata and it picks up on the next run.
But the real win wasn’t just the speed. It was how the whole system finally felt.
The Lowkey Most Important Part, Don’t Skip This
If you skimmed the whole post (no judgment), at least lock these in:
Sequential pipelines don’t hit different at scale
What works for 10 tables will genuinely humble you at 140. Design for parallelism from the start, future you will send a thank you note.
Execution order is your safety net
You don’t need to parallelize everything, that’s the trap. You parallelize within dependency boundaries. Execution orders are what keep your dims loading before your facts without you babysitting the pipeline.
Metadata-driven orchestration is main character energy
When adding a new table requires zero code changes, your pipeline becomes self-service. That’s real leverage.
Fail loudly. Always. Non-negotiable
Silent failures are your 6am on-call alert waiting to happen. Build exception handling that surfaces errors immediately, clearly, and without mercy.
What’s Next
The Bronze → Silver leg was a parallelism problem. Clean diagnosis, clean fix.
The Silver → Gold leg? That one had a different kind of villain, stale views, undetected SQL changes, and materialized views quietly serving wrong data to dashboards. Plus its own parallelism story.
That’s Part 2. Coming soon.
If this was helpful, follow me for more real-world data engineering content. I write about the stuff that actually happens at work, not just the happy path from the docs.